Classifier performance & limitations#
Every number on this page is computed on a stratified 20 % hold-out split of the same atlas the models were trained on — cells from the identical datasets, protocols, and annotation pipeline, simply withheld from fitting. They therefore describe the models’ ceiling: accuracy under near-ideal, in-distribution conditions, scored against the atlas’s own labels (themselves a model of the biology, not ground truth).
Read them as a prior, not a guarantee. On an external query — different chemistry, batch structure, dissociation, or disease context — expect these numbers to drop, typically most for the classes that are already weak here. Use the per-class recalls to know which labels the model resolves confidently and which it does not, then check the predictions against your data — canonical markers, expected compositions, known biology — before treating any call as fact.
Note
The human atlas is annotated at Level-4 resolution and the mouse atlas at Level-3; each table and plot below uses its atlas’s native granularity.
Headline metrics#
Each row is one stage of the hierarchy. accuracy is the overall fraction of
correct calls; macro-F1 averages F1 across classes without weighting by class
size, so it falls sharply when small populations are misclassified. The gap
between the two columns is a direct read-out of how uneven per-class performance
is.
Human (Level-4)#
Stage |
Cells |
Accuracy |
Macro-F1 |
|---|---|---|---|
Root — Malignant vs Non-Malignant |
215,664 |
0.959 |
0.955 |
Malignant Level-4 sub-classifier |
75,397 |
0.950 |
0.878 |
Non-malignant Level-4 sub-classifier |
140,267 |
0.893 |
0.860 |
Combined hierarchy (end-to-end) |
215,664 |
0.879 |
0.837 |
Mouse (Level-3)#
Stage |
Cells |
Accuracy |
Macro-F1 |
|---|---|---|---|
Root — Malignant vs Non-Malignant |
120,534 |
0.993 |
0.989 |
Malignant Level-3 sub-classifier |
25,847 |
0.925 |
0.871 |
Non-malignant Level-3 sub-classifier |
94,687 |
0.894 |
0.735 |
Combined hierarchy (end-to-end) |
120,534 |
0.895 |
0.743 |
Per-class accuracy#
The combined plots show the end-to-end behaviour of
scpdac.tl.predict_labels: each hold-out cell is routed by the root model, then
labelled by the matching sub-classifier. The per-branch plots score each
sub-classifier in isolation on its true cells, so the difference between a branch
plot and the combined plot is the price of root-level routing errors.
Human (Level-4)#
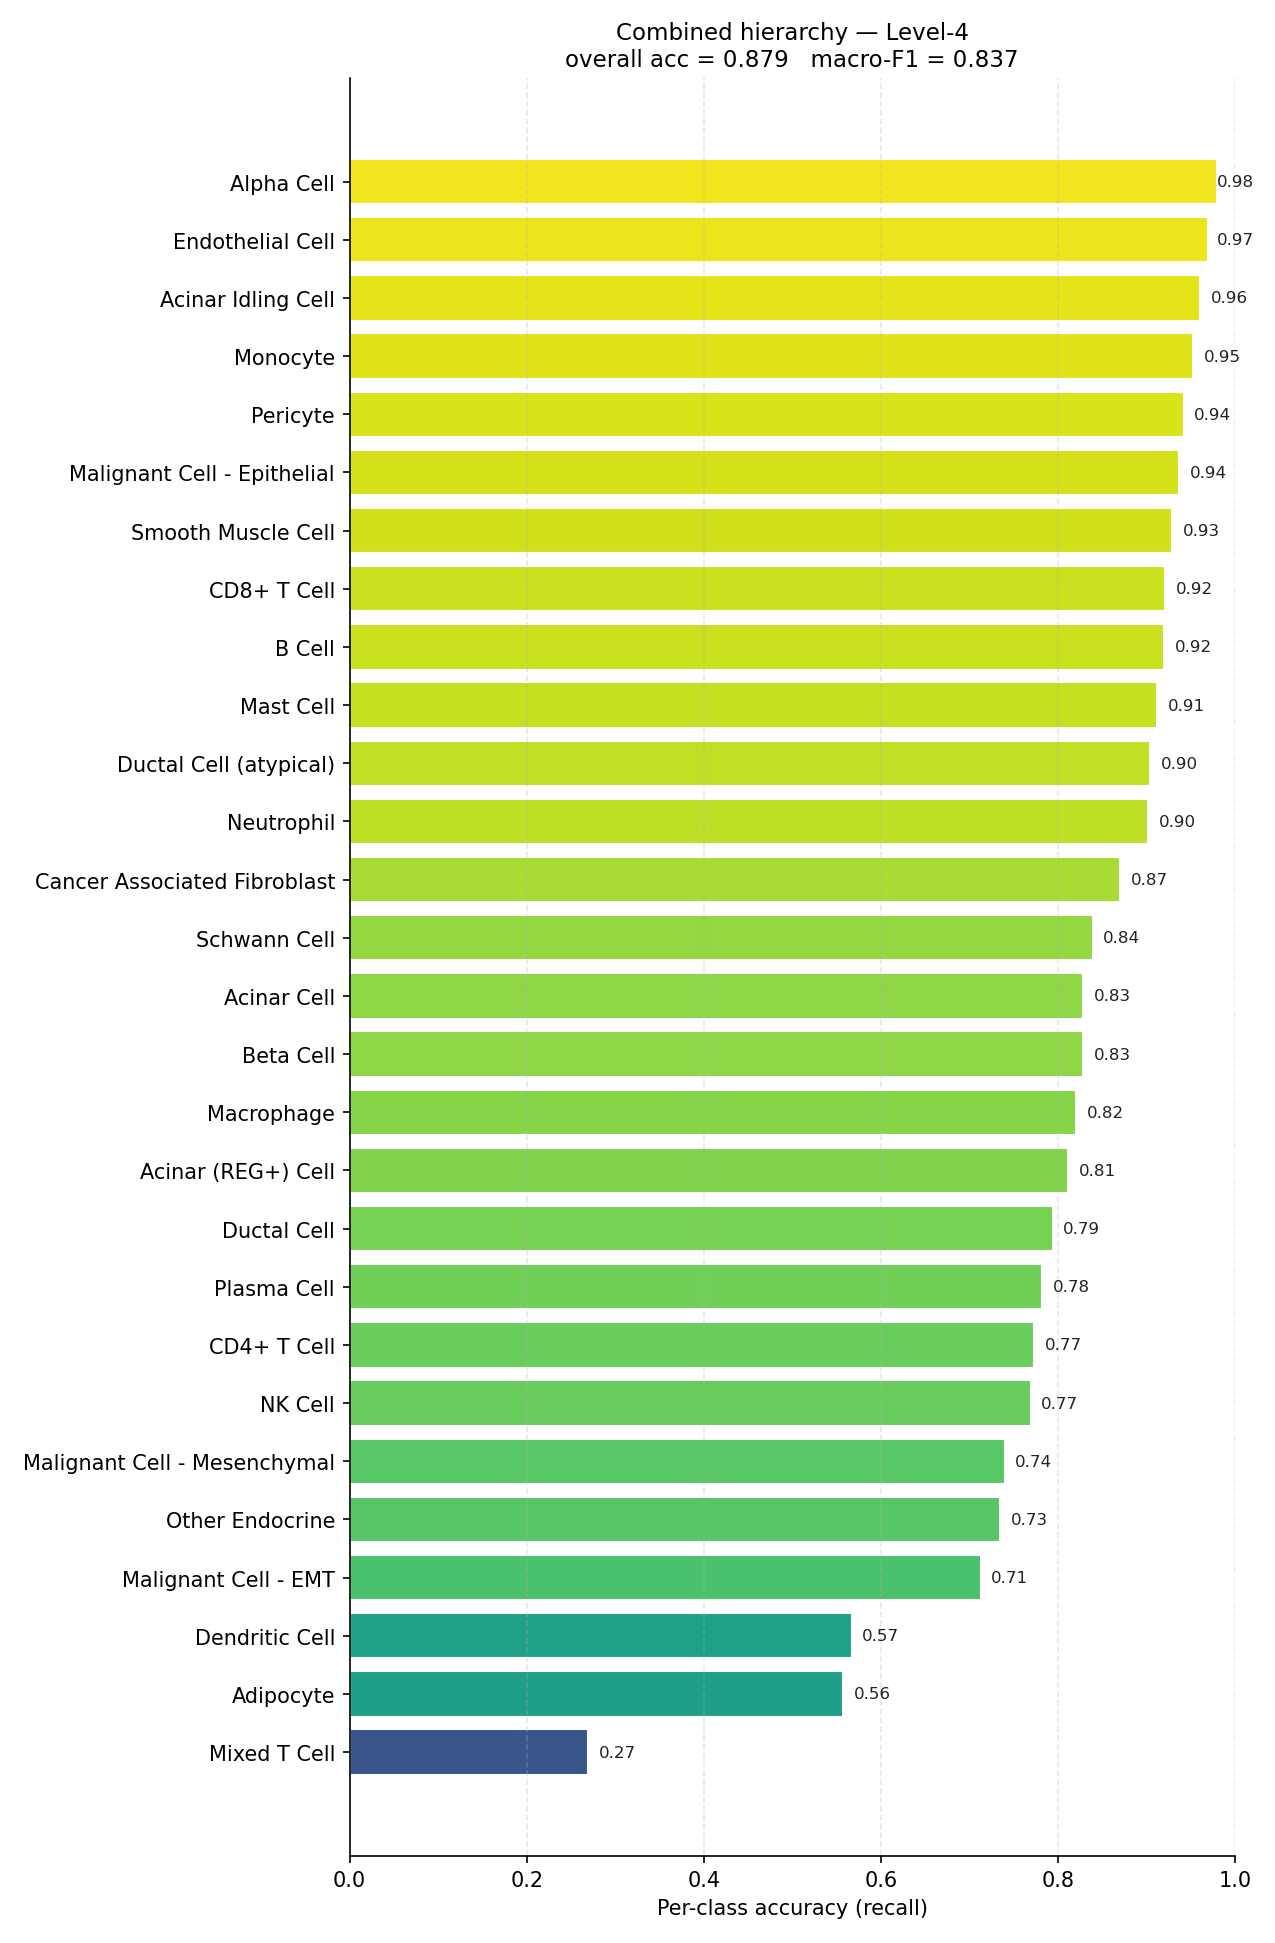
End-to-end per-class accuracy (recall) for the full human hierarchy.#
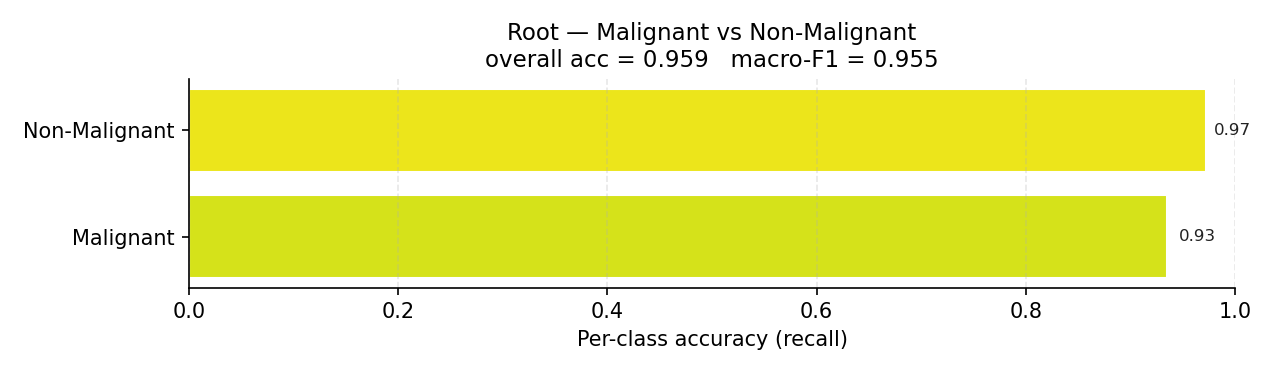
Root classifier: Malignant vs Non-Malignant.#
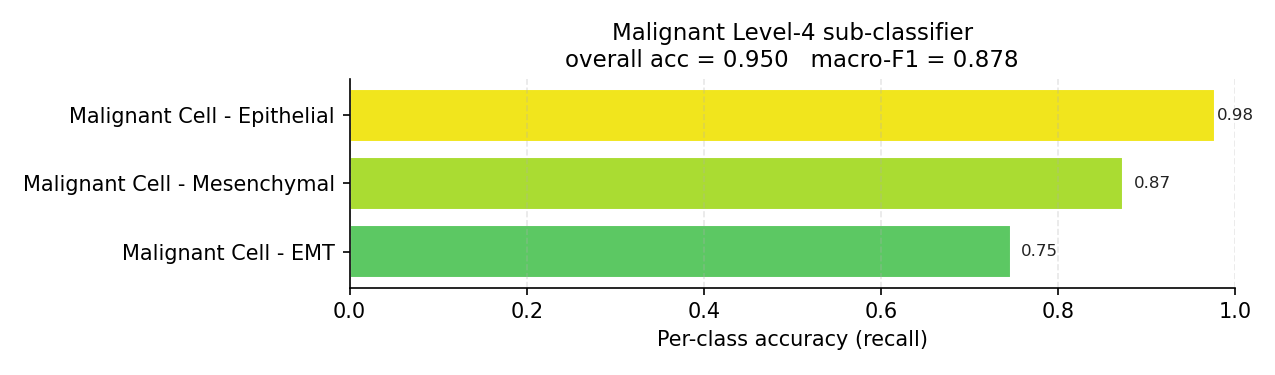
Malignant Level-4 sub-classifier (evaluated on true malignant cells).#
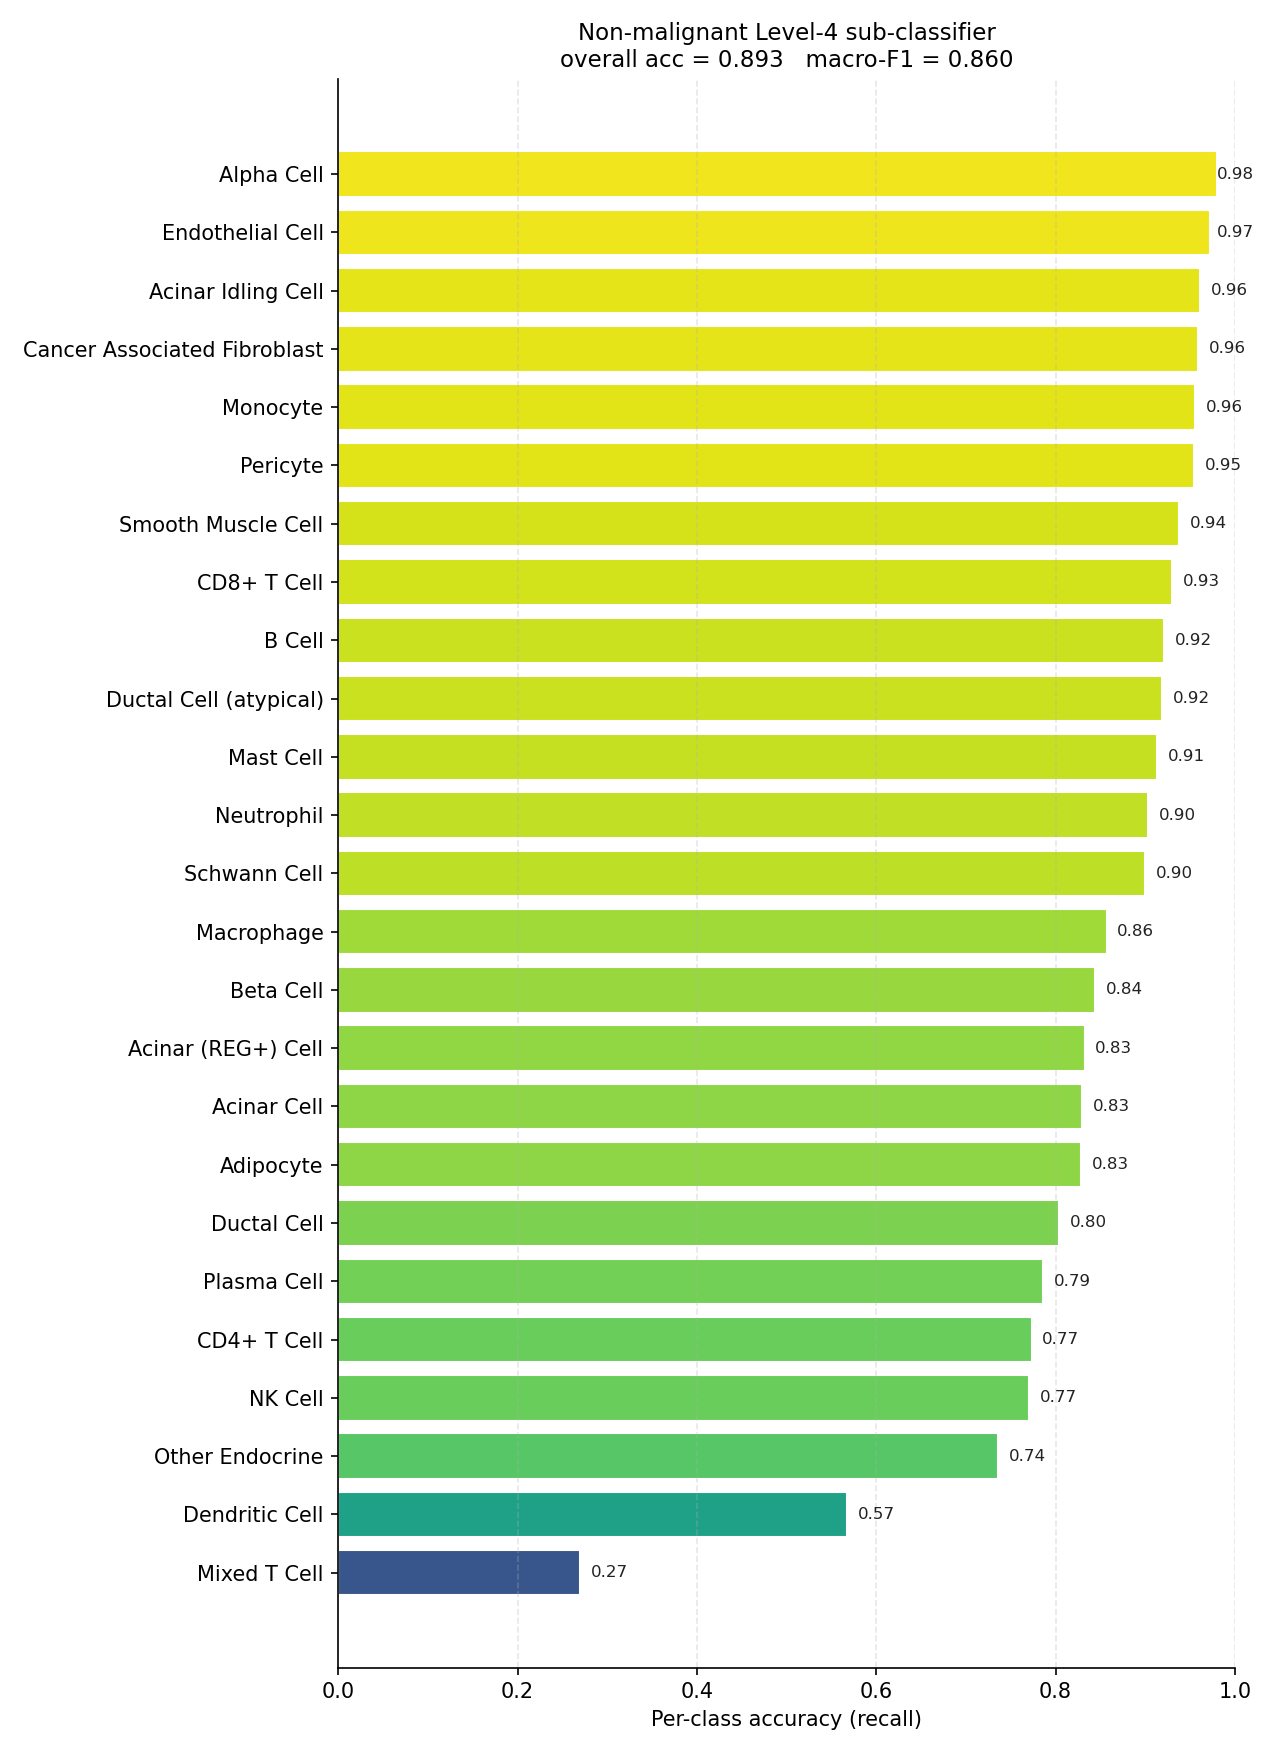
Non-malignant Level-4 sub-classifier (evaluated on true non-malignant cells).#
Mouse (Level-3)#
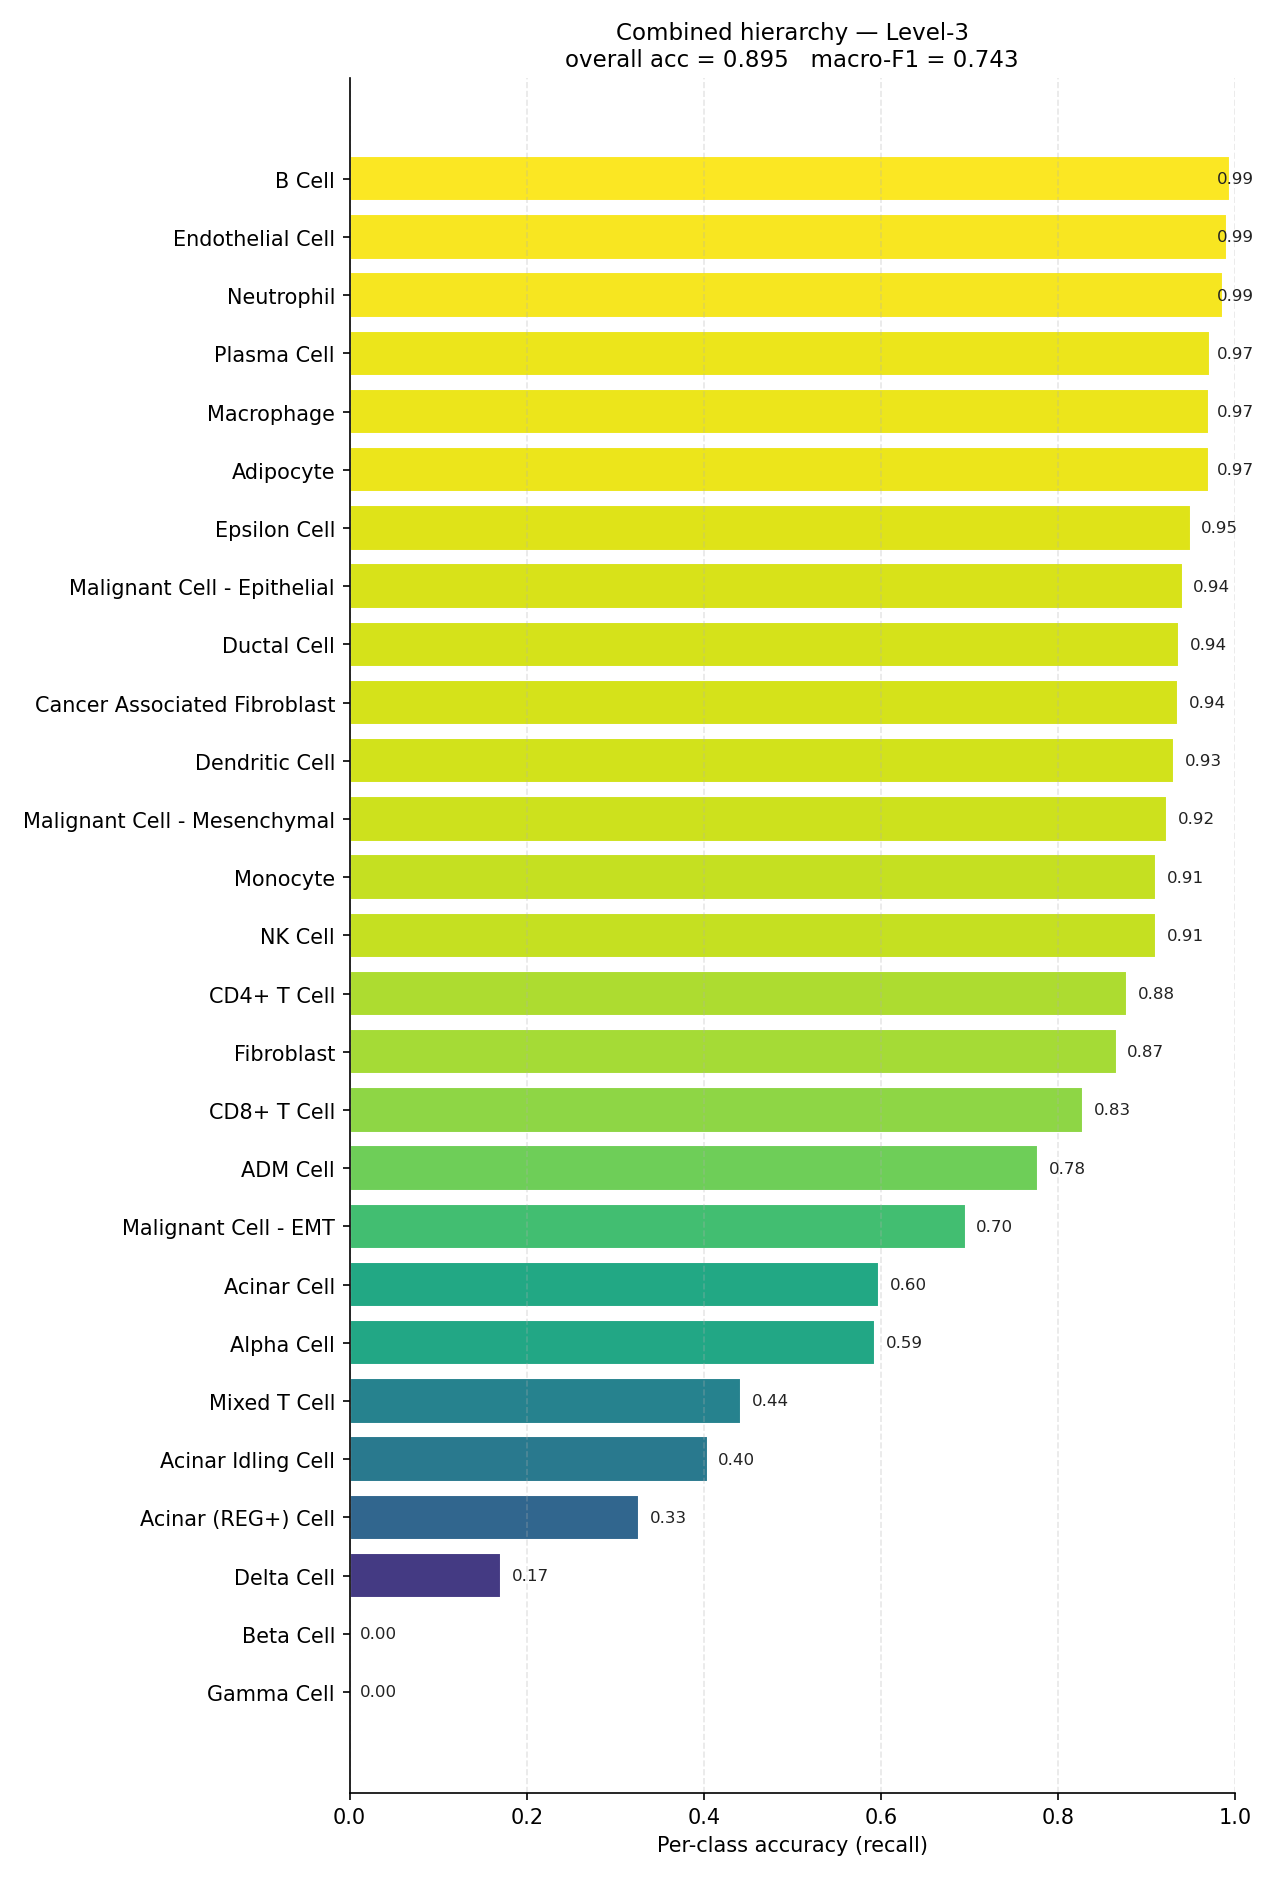
End-to-end per-class accuracy (recall) for the full mouse hierarchy.#
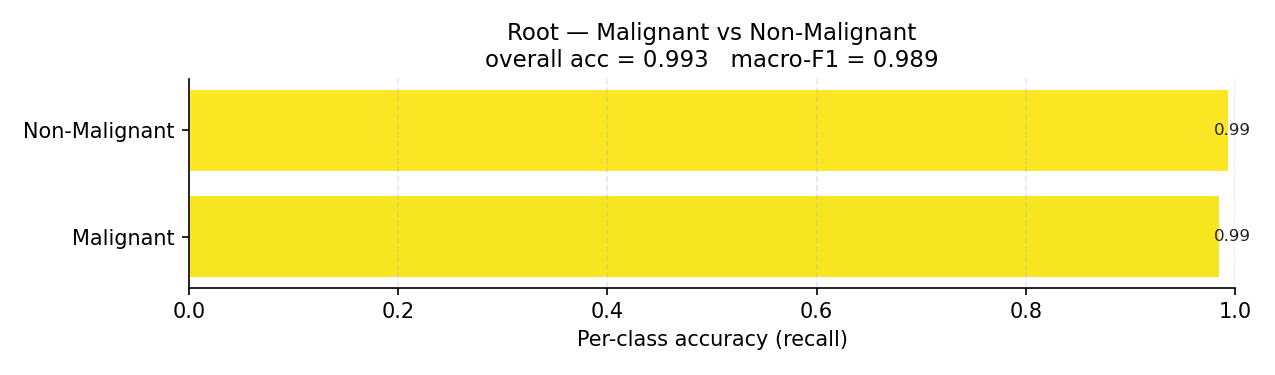
Root classifier: Malignant vs Non-Malignant.#
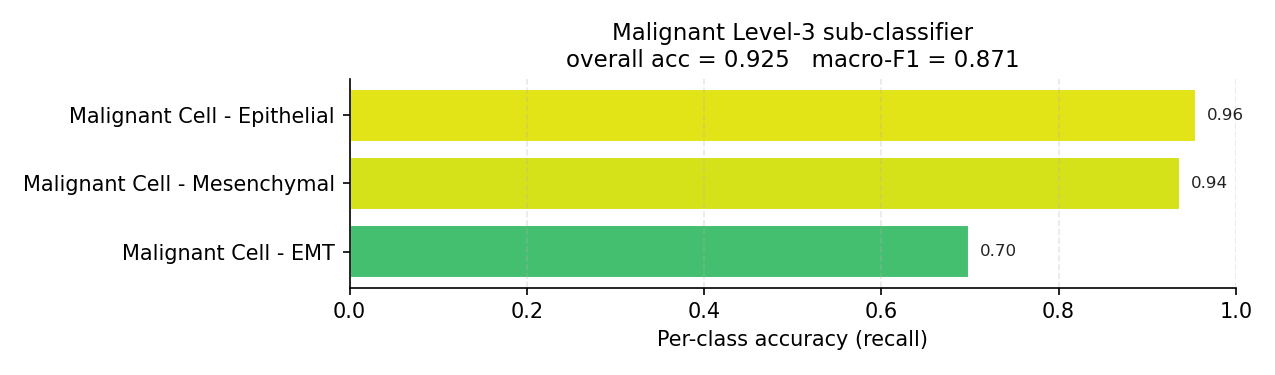
Malignant Level-3 sub-classifier (evaluated on true malignant cells).#
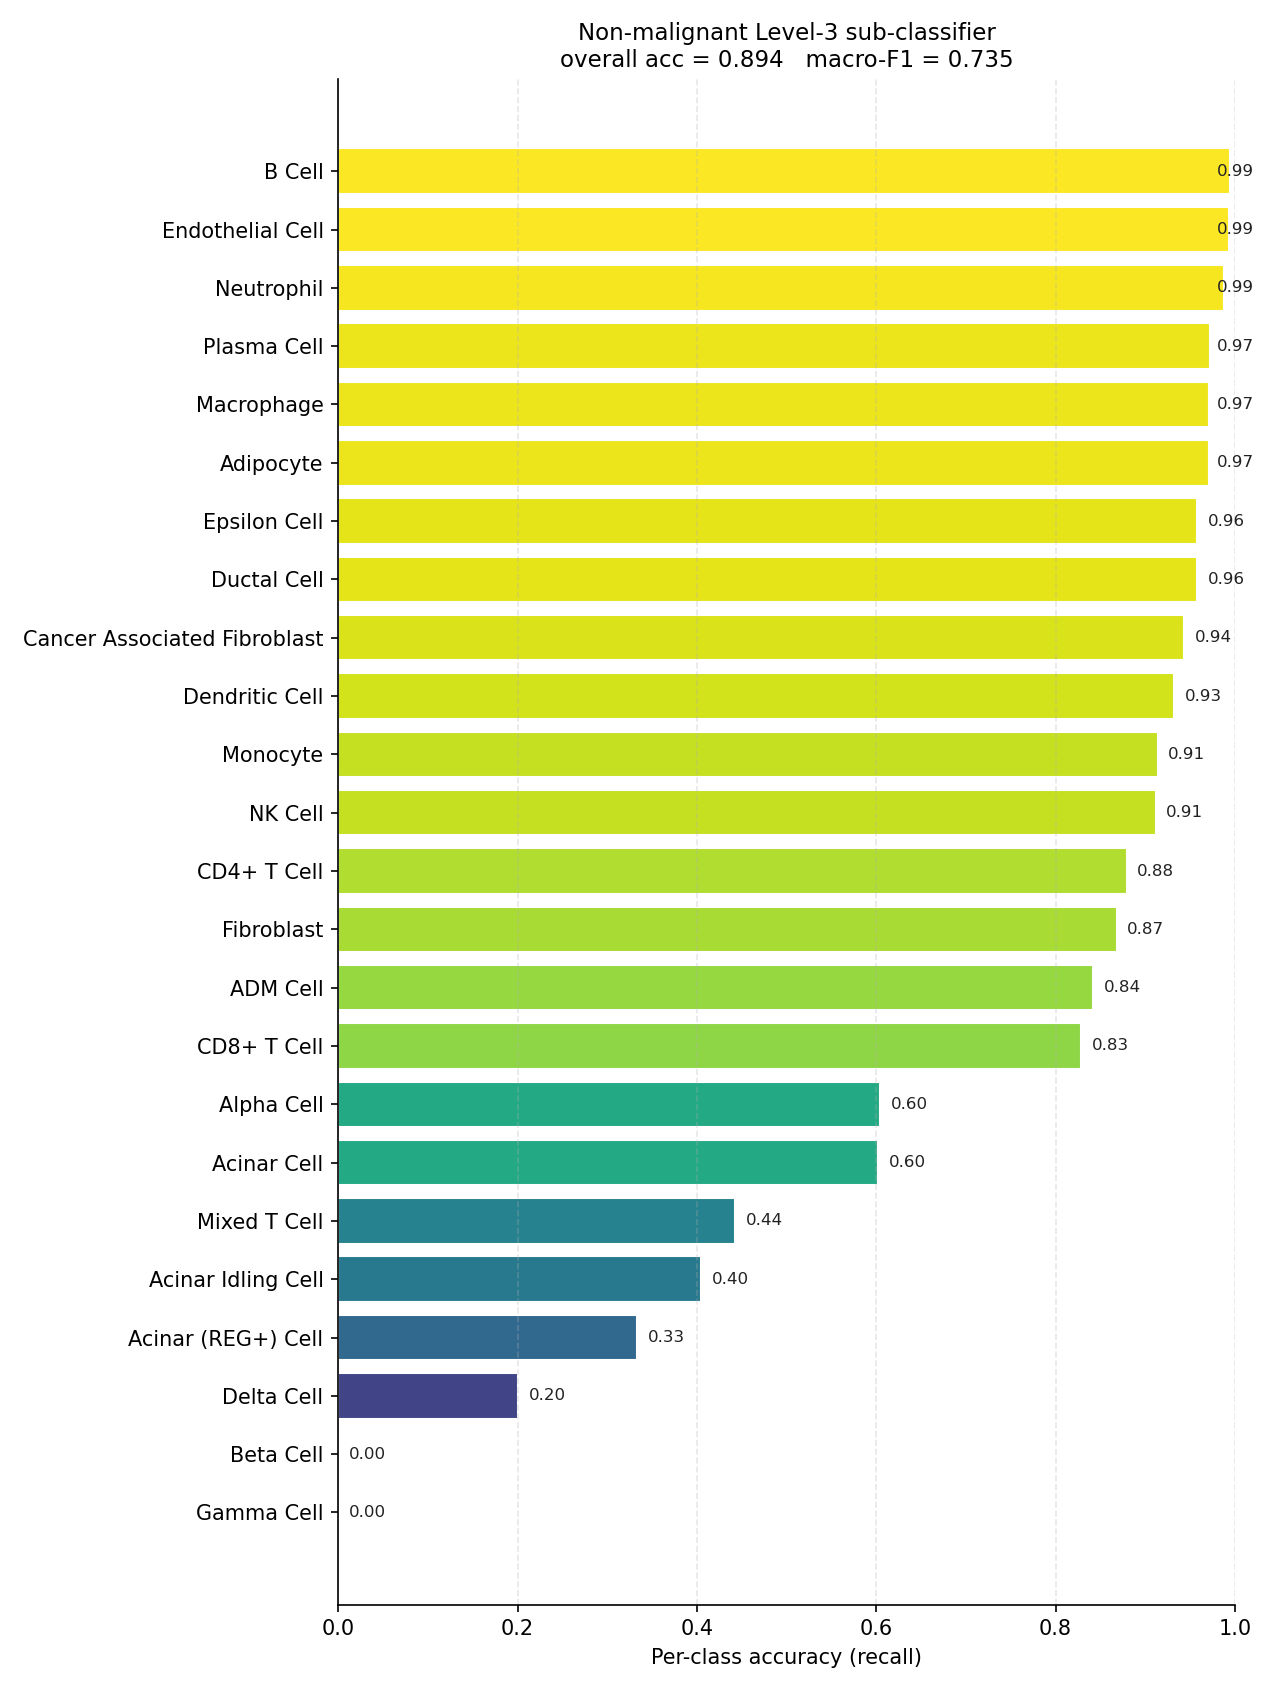
Non-malignant Level-3 sub-classifier (evaluated on true non-malignant cells).#
Limitations#
The headline number is carried by the abundant classes#
Accuracy is dominated by the largest populations; macro-F1 is not. The mouse combined hierarchy sits at 0.895 accuracy but 0.743 macro-F1 — the ~15-point gap is entirely rare-class error. The per-class bars, not the summary metric, are the honest description of what the model can and cannot resolve.
Rare classes can collapse to zero recall#
At the tail of the mouse combined plot, Beta Cell and Gamma Cell reach
0.00 recall and Delta Cell 0.17: the scarce endocrine populations are
almost entirely reassigned to more abundant neighbours. In human the weakest are
Mixed T Cell (0.27), Adipocyte (0.56) and Dendritic Cell
(0.57). For any low-support label, a confident-looking prediction is not
evidence the class was actually recovered — verify it directly.
Continuum states have no clean boundary#
Recall degrades wherever the label discretises a gradient rather than a discrete
identity: the malignant EMT state (0.71–0.75), the transitional Acinar Idling
/ Acinar (REG+) states, and Mixed T Cell are confused with their neighbours
even when the parent branch is correct. This is a limit of the labelling scheme,
not only of the model.
Routing errors are unrecoverable#
Cells are dispatched by the root call, so a Malignant / Non-Malignant mistake
sends a cell to a sub-classifier that cannot emit its true label. The root is
accurate (0.96 human, 0.99 mouse), so the effect is small — but it is a hard
ceiling on end-to-end accuracy, and it is why the combined plots sit below the
corresponding branch plots.
In-distribution scores do not transfer for free#
These models were fit on the PDAC atlas. Queries from other protocols, tissues, or conditions are out-of-distribution and will generally score lower than the tables above. At inference the query is realigned to the training gene panel and missing genes are silently zero-imputed — a query lacking many panel genes degrades without raising an error. Outputs are point predictions with no calibrated uncertainty. Validate against canonical markers (see the end of the classifier tutorial) before drawing biological conclusions.
Reproducing these figures#
The plots and metrics.csv files are written by the training script, which carves
out the hold-out split and evaluates every model on it:
python scripts/train_classifier.py \
    --species human \
    --atlas /path/to/Human_Atlas_Harmonised.zarr
Outputs land in scripts/eval_outputs/<species>/.